Applying Decision Analysis to Venture Investing

Clint Korver, Class 14
Vinod Khosla once said it takes seven years and $30 million to train a venture capitalist (VC).1 Failure may be the best teacher, but failure in early-stage investing comes at a high cost. When I started my career in private equity I knew I would have my share of experiential education through failed investments, but I also believed I could shorten my learning curve and—by finding a way to make smarter decisions—possibly limit the tuition costs of becoming a venture investor.
The framework I adopted to improve my investment judgment was decision analysis, a rigorous and sophisticated set of tools that have been adopted as best practice in industries analogous to venture, such as pharmaceutical research and development and upstream oil and gas exploration. All three industries require large amounts of initial capital, face significant uncertainty, and achieve success (if ever) years after the original investment. I found the similarities compelling, and with my academic background in decision analysis (including a PhD from Stanford) and 20 years of experience applying it to a wide range of problems and industries, I was well prepared to develop a decision-analysis framework for venture investing.This article opens by examining the challenges of venture decision-making and describing how a decision analytic approach can overcome these challenges to produce more informed decisions. The main discussion illustrates how we at Ulu Ventures, where I am a co-founder and partner, applied this approach to an early-stage investment in Inkling, an interactive textbook platform for the iPad. I conclude with a consideration of the implications of decision analysis for the venture industry.
The Inherent Difficulty of Venture Decisions
Venture is a tough business that requires meaningful commitments of resources in the face of extreme uncertainty and dynamic markets. Most startups involve some combination of unproven technologies, inexperienced teams, undeveloped markets, and untested business models. Information tends to be incomplete and unreliable. The most promising markets tend to change quickly and domain expertise becomes obsolete just as quickly.
To make matters worse, venture is a terrible learning environment. The average venture capitalist only makes a few decisions a year, and it takes years to see if these decisions result in good or bad outcomes. Few data points and long feedback loops make for slow learning, while the extreme uncertainty makes it difficult to learn the right lessons. In this business, it is too easy to confuse luck with skill.Cognitive psychologists Daniel Kahneman and Amos Tversky have shown that humans are prone to thinking errors—cognitive biases—when assessing uncertain events or making decisions in the face of uncertainty.2 Most people rely on heuristics to simplify the complex task of assessing probabilities and forecasting value when faced with uncertainties, but while "in general, these heuristics are quite useful…sometimes they lead to severe and systematic errors."3Relying solely on heuristic analysis creates a number of potential dangers for VCs and the companies they work with. For example, representativeness is a pattern-matching bias in which a person judges risk based on how closely one situation resembles another, while not being sensitive enough to relevant statistical facts (such facts could include the underlying base rates, the validity of results from small samples, the likelihood of "black swans,"4 and other limits to predictive accuracy).When a VC falls in love with a startup, they are susceptible to confirmation bias: a tendency to search for or interpret information in a way that confirms one's preconceptions. To combat this bias some venture firms assign a devil's advocate or require a unanimous partner vote for an investment.Anchoring is the tendency to rely too heavily on one factor or piece of information when making decisions. Anchoring often comes disguised as hard won experience, and painful experiences tend to create strong anchors. For example, if a promising portfolio company fails because of the CEO's technical failings, I am likely to be extra sensitive to any CEO's technical expertise in the future, regardless of its importance for that particular venture.Thinking you are smart (a common trait among VCs I know) deepens the effects of these biases. According to Chris Argyris, a learning expert from Harvard, smart people tend to make the worst learners.5 When smart people think they have figured something out (e.g., successful startup CEOs must have deep technical expertise) they become closed to other points of view. As one becomes immune to contradictory evidence, one's bias becomes self-sealing and learning slows. Being aware of these potential decision traps, I knew I wanted a more reliable system than just heuristic analysis.
Decision Analysis as Best Practice
Decision analysis is a framework (principles, processes, and tools) for making high-quality decisions that marries the art and science of decision-making through a disciplined process. The definition I find most evocative is "high-quality conversation leading to clarity of action."6
Decision analysis was developed at the Stanford School of Engineering and the Harvard Business School. Because of the academic orientation and historic focus on quantitative analysis, users of decision analysis have typically been leading companies in large industries, such as pharmaceutical, oil and gas, utilities, automotive, and (to a lesser extent) financial services. These organizations have generally used decision analysis to make resource-allocation decisions, capital decisions, portfolio decisions—any decision that could be mathematically modeled from a quantifiable set of values.After finishing my PhD in decision analysis at Stanford, I spent 14 years building companies that delivered decision-analysis software, training, and consulting to these large companies. For the last three years I have been applying these same principles at Ulu Ventures, where we have created—and are continuously modifying and improving—an investment framework that has informed dozens of investment decisions.This framework does not ignore intuition, pattern matching, or judgment: these are the foundations upon which venture decisions are made. Decision analysis can and does, however, provide a structure that guides our investment intuition, much as navigation instrumentation in a plane helps pilots find an airport in darkness or bad weather.Done well, this framework simplifies the complex problem of early-stage investing, focusing attention on what matters most and allowing investors to ignore immaterial factors with confidence. The magic is in the simplification. Every early-stage investment has a myriad of considerations, risks, and dynamics to keep straight—but only a small number of them matter. The best investors have a knack for intuitively identifying those important few; however, as returns over the last decade have demonstrated, this knack does not always adjust to changes in the market. At Ulu, we think our framework of instruments can help.
Decision Analysis Applied: Inkling, Inc.
Miriam Rivera, my partner at Ulu Ventures, and I first met Inkling in October 2009 when they were raising a seed round to build an interactive textbook platform for the iPad. While this seems like an obvious idea now, at the time the iPad was still just a rumor. This section presents Inkling's journey through Ulu Venture's investment decision-making process, highlighting the role of decision analysis along the way.
Ulu Ventures Investment Criteria
We look at three primary decision criteria for all of Ulu's investments: a visionary entrepreneur, a home-run market opportunity, and attractive risk/reward. The first two are fairly common and straightforward, but our approach to assessing risk/reward is quite different and is where the decision-analysis framework shines.
When we applied our first two criteria to Inkling, the results were encouraging. Matt MacInnis, Inkling's founder and CEO, had worked in Apple education for many years and told a compelling story about how upcoming changes in education would be driven by tablet computers. We were impressed by Matt's deep domain expertise and vision for how Inkling would transform the textbook market using this new platform. We also admired Matt's integrity (he did not disclose any confidential, non-public information about Apple's iPad development program). Visionary entrepreneur—check.The textbook market is large, broken, and ripe for disruption. Annual new U.S. textbook sales are about $5 billion, and used sales are around $2 billion.7 It is often called a "broken market" because those choosing the textbooks (faculty) are not the ones buying the textbooks (students), a disconnect that reduces pricing pressure as faculty prefer up-to-date content and are less concerned about costs. Publishers take advantage of this disconnect by releasing new editions with only modest changes in content or by bundling in other materials, tactics that drive new book sales and minimize cannibalization from used books. Even so, long production times mean that material in new textbooks is often one or two years old. High prices, dated information, and perceived gimmicks have created a large, underserved base of customers hungry for better options.8 Home run market opportunity—check.Matt made a real impression on us during that first meeting and we immediately moved to the next step in our process—evaluating the risk/reward. Our target metric is a 10x probability-weighted multiple on our investment. Many VCs target a 10x return, but a probability-weighted 10x is an entirely different matter, as shown below.
Risk Assessment: Early Stage
We start our risk assessment by looking at the market, product, team, and financial risks for each company (figure 1). While this is standard operating procedure for venture investors, at Ulu we go a step further by assigning probabilities to each factor, representing the likelihood the entrepreneur will be able to overcome each particular risk. By using probabilities, we discipline ourselves to think clearly and communicate precisely about our intuition.
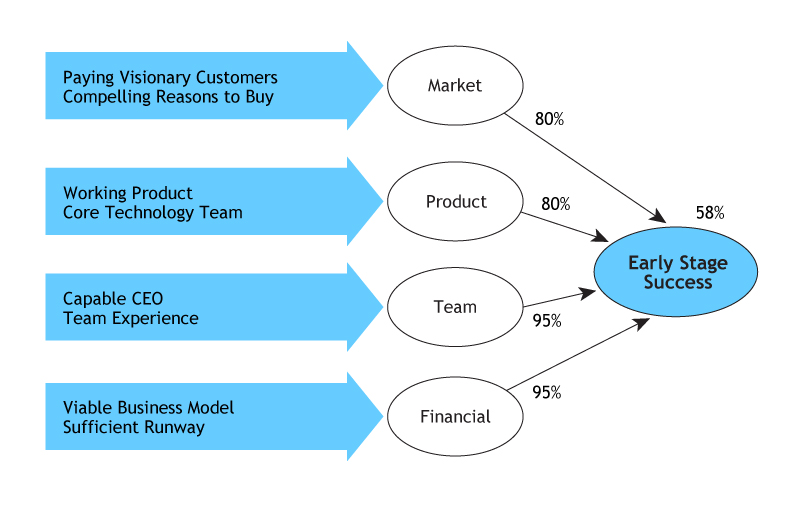
Figure 1. Evaluation of Inkling's Early-stage Risks.Author's image.
Market Risk
We gave Inkling an 80 percent chance of achieving market success—namely, finding paying visionary customers and developing compelling reasons for other customers to buy. This probability was based on our experience with other early-stage startups similar to Inkling and our knowledge of the education space. The higher education industry is hungry for innovation, and we knew of a number of schools looking to experiment with new technologies. Since Inkling only needed to find a few schools willing to try a pilot project or a few professors willing to test an iPad textbook in their class, we believed they had a high but not certain chance of overcoming the early-stage market risks: hence our 80 percent assessment (figure 1, row 1).
Product Risk
Inkling did not have a working product yet—they did not even have an iPad to program. But they did have a working proof of concept on the iPod, and their engineers had built successful products on this platform in the past. Like the market area, there was risk, but it seemed manageable: another 80 percent assessment (figure 1, row 2).
Team Risk
Matt MacInnis worked in Apple education for eight years prior to starting Inkling. He had impressive domain expertise, knew many of the important players in this market, and had experience managing teams. On a personal level, he was passionate, driven, and a compelling salesperson. He seemed ideally suited to lead Inkling through the early stages: a 95 percent assessment (figure 1, row 3).
Financial Risk
Inkling's other co-investors were a savvy group from Google with deep pockets and domain expertise. We knew many of them and had confidence they would continue funding Inkling if they were making good progress: another 95 percent assessment (figure 1, row 4).
Overall Early-Stage Risk Assessment
For Inkling to achieve early-stage success, they would have to successfully overcome all four of these risks—any one of them could kill the company. Therefore, to calculate the chance of Inkling achieving early-stage success, we take the product of the small risks. In other words, .80 * .80 * .95 * .95 = 58 percent (figure 1). This is only slightly better than a 50/50 chance. As this example illustrates, small risks add up quickly in early-stage investing.
Risk Assessment: Crossing the Chasm
Early-stage success is just the first step in a long journey to building a meaningful company. The other life stages, adapted from Geoffrey Moore's work,9 include crossing the chasm and then achieving mass-market success.
For Inkling to "cross the chasm," it would have to transition from visionary customers willing to put up with hassles to pragmatic customers who only buy products that are easy to find and use. Inkling faced an additional obstacle: a pragmatic customer would first have to buy an iPad or a tablet computer of some sort.At the time we were considering this investment, the iPad had not launched, so iPad adoption in education was unknown and one of Inkling's biggest risks. As a result, we assessed only a 40 percent probability that Inkling would be able to overcome the market risks required for crossing the chasm (figure 2, row 1).
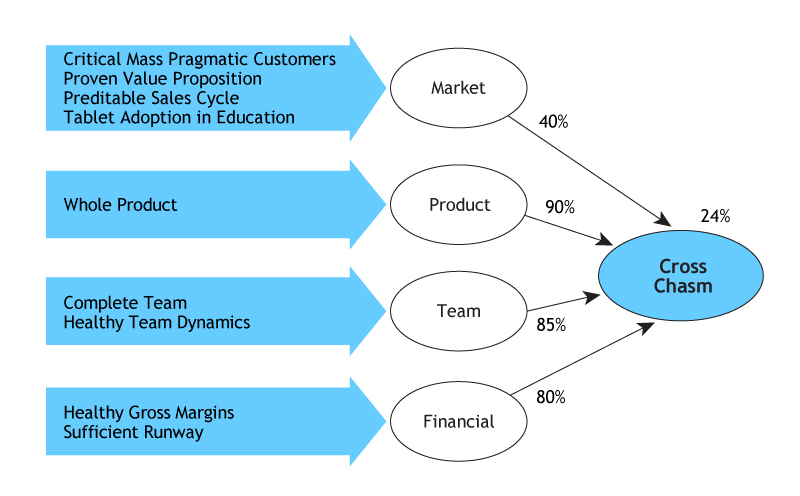
Figure 2. Evaluation of Inkling's Crossing the Chasm Risks.Author's image.
We also assessed the specific product, team, and financial risks inherent in moving from early-stage development to market success, and taking the product of all four risks, we calculated Inkling had a 24 percent chance of crossing the chasm (figure 2). For many investors, this assessment would be the kiss of death— however, this evaluation is only one piece of a larger puzzle. In early-stage investing, large risks can be outweighed by even larger returns.
Risk Assessment: Mass Market
If Inkling successfully crosses the chasm, they become a going concern serving a niche market such as medical schools or California state universities. To achieve mass-market success, Inkling must overcome another set of operational and financial risks (figure 3).
Educational institutions tend to share best practices, so it was plausible that Inkling's success in one niche market would naturally lead them to opportunities in other niches and eventually the mass market. We assessed a 60 percent probability of overcoming the market risks. Product, team, and financial challenges to mass-market success also existed (figure 3)—scaling production, scaling a sales organization, establishing appropriate revenue sharing relationships—but we felt all were manageable. Taken together, we saw these combined risks translating into a 37 percent chance Inkling would be able to overcome the hurdles and achieve success in the broader market for educational textbooks.
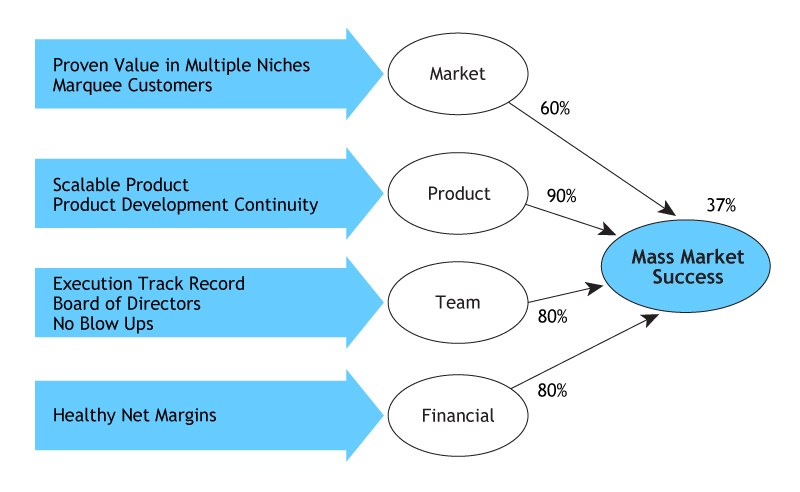
Figure 3. Evaluation of Inkling's Mass Market Risks.Author's image.
Mass-Market Share
If Inkling achieved mass-market success, what share of this market could Inkling capture and sustain? In The Gorilla Game,10 Geoffrey Moore describes a framework for understanding the competitive dynamics in high technology markets. Based on this framework we assessed Inkling's ability for sustainable differentiation at this level through switching costs, network effects, and relationship and technology barriers to entry (how these come together as a quantifiable probability is material for another article). Our conclusion was that if Inkling became a mass-market player, they would have a 25 percent chance of becoming the market leader, a 50 percent chance of being a challenger, and a 25 percent chance of being an also-ran.
Representing Risks in Simplified Form
All of these risk assessments from early stage through mass-market share can be summarized in a decision tree (figure 4). Each node in the tree represents the product of all risks for each life stage. The first node shows the 58 percent chance of early-stage success that we computed (as well as the corresponding 42 percent chance of failure). If Inkling achieves early-stage success, the next branch is the 24 percent versus 76 percent likelihood we determined for the company's chances of crossing the chasm, and so on.
The numbers at the right side of the branches show the ultimate probability of each scenario. For example, Inkling has a 1 percent chance of achieving the topmost branch of market leadership by being on the topside of each of these branches. The chance of this scenario can be calculated by multiplying the chance of early-stage success * chance of crossing the chasm * chance of mass-market success * chance of becoming a market leader = .58 * .24 * .37 * .25 = 1 percent.The bottom two branches represent no money back to the investors; in this sense, Inkling has an 86 percent chance of failure. This sounds terrible, of course, but this is the nature of nature of early-stage investing. It is a high-risk undertaking, but if you get it right, the rewards can be tremendous.The top four branches show that Inkling has a 14 percent chance of becoming a going concern and returning some money back to investors. It looked bad for Inkling, but remember: Inkling had a visionary entrepreneur and a large market ripe for disruption. The key now was to determine how big an Inkling success could be.
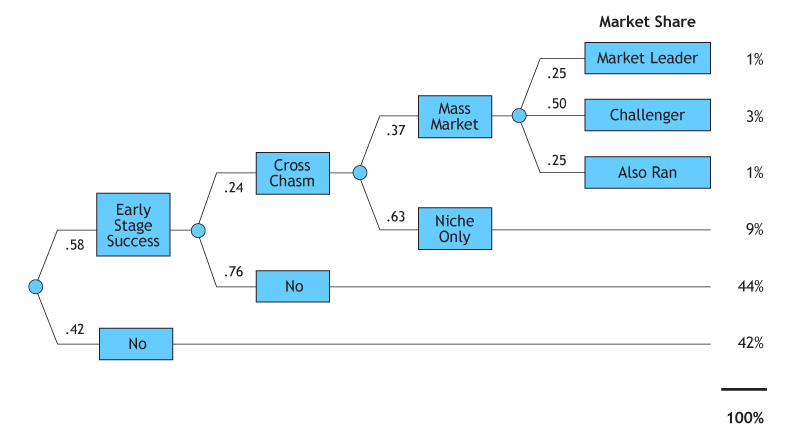
Figure 4. Evaluation of Inkling's Lifestage Risks.Author's image.
Mapping Inkling's Potential
To assess Inkling's potential value, we locked ourselves in a room with Matt, tore his business model apart, and then built it back up graphically (figure 5). This decision diagram represents a map of our conversation,11 showing the key drivers of risk and value in Inkling's business.
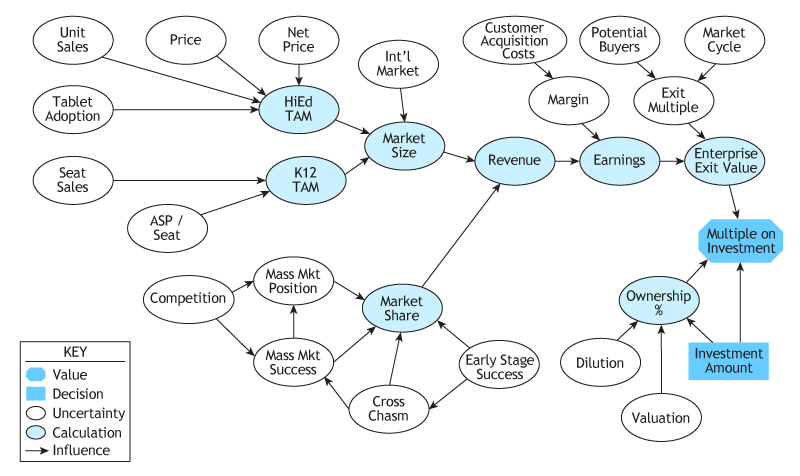
Figure 5. Decision Diagram Showing Inkling's Drivers of Risk and Value.Author's image.
We started by examining Inkling's target market, higher education. Our goal was to understand Inkling's total addressable market (TAM) in higher education, as shown by the bubble in the upper left labeled "HiEd TAM." We identified four key drivers: tablet adoption among higher education students (Tablet Adoption), average digital textbook unit sales per student with a tablet (Unit Sales), average retail price per digital textbook (Price), and the percent of this price Inkling would keep after Apple's cut (Net Price).We then moved on to the grade school or K-12 market, which Matt thought would require a different business model. Where selling individual textbooks to individual students suited the college market, Matt believed selling a suite of textbooks and charging on a per-student basis would be a better fit for K-12 customers.Our conversation continued through revenue, earnings, exit multiples, dilution, and so on. Every important concern or potential driver of value had a spot on the map.On the surface this may look like just another block diagram, but it precisely specifies a quantitative decision model. Each oval represents an uncertainty with an underlying probability distribution. Each rectangle represents a decision with an underlying set of choices. The eight-sided node represents the value we were using to base our choices. The arrows represent influences, showing the mathematical relationships between the nodes. Our next step was to quantify all of the uncertainties.
Ranges Structure Intuition
The conventional wisdom governing financial projections is "garbage in/garbage out." Inkling's business case showed a 25 percent tablet-adoption rate in higher education in five years, but this adoption rate was informed guesswork at best. No single number forecast for adoption of a new technology is credible. Frankly no single number forecast for anything five years in the future is likely to be credible even for the most mature businesses. This is why most venture investors have only limited use for models in their decision-making.
Ranges are a more useful approach to forecasting, as they solve the garbage in/garbage out problem by recasting the projection question from "Where will we be?" to "How wrong could we be?" In the case of Inkling we were assessing how wrong we could be about tablet adoption in higher education. Matt's range of possibilities for tablet adoption spread from a low of 10 percent, to a base of 25 percent, to a high of 40 percent. This format of low/base/high captures Matt's knowledge about tablet adoption, both what he knows and what he does not know. The width of the range represents Matt's level of uncertainty.To de-bias these assessments and ensure that assessments are consistent across all uncertainties, we use specific techniques such as back casting. Examples of back casting questions are "Suppose we were sitting here five years from now and I show you a report detailing tablet adoption in higher education. What would be a surprisingly low percent of adoption? What happened?"As an expert in the field, Matt should be able to generate thoughtful and compelling answers, and his rationale provided an added layer of insight and richness to our understanding of the risks. This same exercise was repeated to capture the high side of the range.Ranges effectively move the discussion from "precisely wrong" to "approximately right." When done consistently across all uncertainties, we are able to systematically test our intuition.
Sensitivity Analysis Focuses Due Diligence
We used the ranges to test our decision model, producing a sensitivity analysis showing which factors mattered the most (figure 6).
The horizontal scale at the top is the probability-weighted multiple on investment (PWMOI)—the metric we care most about. Along the left side of the chart, we listed all the variables from the model (i.e., the uncertainties from figure 5). Along the right side of the chart, we listed each variable's base value from our low/base/high range discussion. For example, the base case for Tablet Adoption is 25 percent.With each variable set to its base case, the value of the Inkling investment is a 9x PWMOI, represented by the vertical line running through the middle of the diagram labeled "Base Value = 9." Now we asked the question: "What if we are wrong about one of our assessments?"Suppose Inkling's Mass Market Share was only 5 percent, the low side of our range. Looking at the left end of the Mass Market Share bar, if Mass Market Share is at 5 percent then the PWMOI multiple drops below 5x. If on the other hand, Mass Market Share is 50 percent, represented by the right end of the bar, the PWMOI is close to 30x. The size of this bar represents how uncertainty about Mass Market Share affects Inkling's probability-weighted multiple, holding all other uncertainties constant at their base values.We then repeated this exercise for each uncertainty, swinging its value from low to high while holding all other uncertainties at their base value. We recorded the swings in the form of bars and organized them in a Pareto sense from the largest to smallest, as in figure 6.

Figure 6. Sensitivity Analysis Showing Inkling's Top Uncertainties.Author's image.
We were now able to address the garbage in/ garbage out issue. Or, to put it more usefully, we could answer the question: "If we were wrong about one of these assessments, does it matter?" Sometimes it did, as in the case of Mass Market Share, Exit Earning Multiple, and the other top bars shown in figure 6. The value of an Inkling investment varied significantly based on the outcome of these uncertainties, hence we focused our due diligence on these issues.More often than not, however, the precise value within a range did not change the attractiveness of an Inkling investment. For example, Pre-Money Valuation is at the bottom of figure 6. We, of course, preferred $3 million while Matt wanted $5 million. However, this range did not affect our PWMOI nearly as much as Tablet Adoption, Exit Multiples, and the other bars above.In addition, this sensitivity analysis only shows 12 of the 29 uncertainties in Inkling's decision model. In other words, Inkling could have been on the low side or the high side of most of these ranges and the attractiveness of the investment would not materially change.More precisely, these uncertainties were not material to our decision in that a more accurate assessment would not change our decision to invest or not invest. There was no decision value in collecting more information, allowing us to confidently de-prioritize these factors in our diligence. In effect, we took what most VCs would consider "garbage" inputs and through decision analysis transformed them into credible, actionable information.
The Bottom Line
We now had all the components we needed to build a complete picture of Inkling's risk and reward. Returning to our decision tree, we added the values of each scenario from our value analysis in figure 6 to produce a scenario analysis (figure 7). Recall that Inkling had a 1 percent chance of achieving the Market Leader Scenario; if Inkling achieved this, they would have $750 million in revenue, an enterprise value of $6 billion, and the MOI would be 420. In other words, for every $1 we invest, Ulu would get $420 back. However, the important number is this multiple discounted by the chance that it would happen. PWMOI is the product of the value of the scenario (420) and the chance of achieving that scenario (1%). Therefore this Market Leader scenario contributes 4.2 to our overall assessment of Inkling's PWMOI.
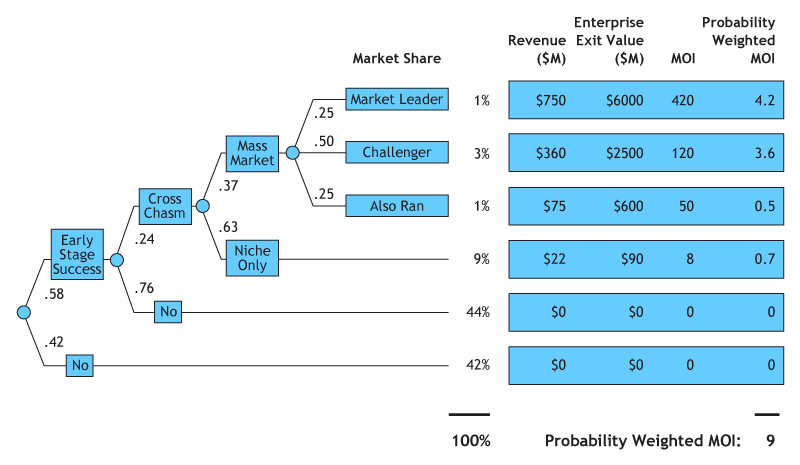
Figure 7. Scenario Analysis Showing Inkling's Risk and Return.Author's image.
We repeated this analysis for each scenario and their sum generated a 9x PWMOI. While this was short of our 10x goal, we do not blindly follow the numbers. The purpose of this exercise is to clarify our thinking. We make decisions based on our judgment, incorporating both quantitative and qualitative considerations. In Inkling's case the founder was a visionary entrepreneur, the textbook market was large and ripe for disruption, and the risk/return analysis was close to our target. As we analyzed Inkling from many different perspectives we found a coherent, compelling story.We invested.
What Happened
The iPad is a runaway hit. Apple sold over 11 million iPads during its September 2011 quarter and over 40 million units since its launch 18 months ago.12 Hundreds of universities are experimenting with the iPad.13 Inkling is riding the wave.
Sequoia Capital led Inkling's Series A; Pearson & McGraw-Hill, the two largest textbook publishers in the world, led Inkling's Series B. Inkling currently has over 80 titles available and partnerships with most major textbook publishers in the United States, giving them access to the majority of currently used textbooks. By Fall 2012, they should have hundreds of titles available. Inkling seems to be a home run in the making.As I look back at this investment two years later, I think we called it about right. We made a smart risk/return trade-off and we got lucky. That combination is the heart of most successful venture investments.
Conclusion
Decision analysis helps people make faster, more informed decisions. At Ulu Ventures, it helps us structure judgment and quantify intuition in forms that can be easily discussed and tested with logic and evidence, driving clarity of thought through a disciplined process. The goal is not "the right answer"—the goal is to apply intuition intelligently to an investment and to guide useful, decision-focused conversations.
Decision analysis helps us learn faster—about the risk and return of individual investments and also about how to practice the craft of venture capital. Inkling's case is typical of early-stage investing in that out of the many possible risks and considerations, only a small handful matter.This framework focuses our attention on what matters most. Anchoring and other biases are reflected in model results that are out of line with our intuition. Our first step is to review the model for errors—if the model checks out, we adjust our intuition. Our framework also naturally improves over time; each time we evaluate a company, we refine our framework and add to our set of benchmark data. We believe this sets us on a path toward competence in this industry, more quickly and costs-effectively than the "seven year and $30 million plan" Vinod Khosla referenced.Decision analysis also helps Ulu's entrepreneurs build their business. Whether we invest or not, we share our analysis with our entrepreneurs. About 20 percent of the time, they change their business model or target market based on our analysis. Most of the time, entrepreneurs walk away with a deeper understanding of their business model. These conversations also help transition us from a diligence role focused on our needs as an investor to a supporting role focused on the needs of our entrepreneurs.While intuition and judgment will always underlie successful venture capital investing, I believe that venture firms will produce better and more consistent results by using disciplined frameworks to assist the investment process. Frameworks act like maps, helping the venture investor see all relevant aspects of a decision in context. Like a well-drawn map, a disciplined framework can help investors plan where to go next and how to get there, which is particularly important when the terrain is difficult or confusing.I hope other VCs will adopt decision analysis or a similar framework as part of their investment processes. In addition to improving results, decision frameworks make it easier for us to work together as an industry in developing and sharing best practices. They codify the art and science of capital formation, allowing us to communicate what we do and how we do it to a wide audience. Frameworks allow us, as a Society of Kauffman Fellows, to make contributions beyond our immediate circle of concern. They offer the potential for our Society and our industry to reach beyond startups to help unlock the creativity and innovation potential of people in other industries and countries.

Clint Korver
Clint co-founded Ulu Ventures, an early-stage IT venture firm, after 15 years as a serial entrepreneur. Clint is also a venture partner at Crescendo Ventures; teaches a graduate level entrepreneurship course at Stanford University; mentors at StartX, the Stanford student-run accelerator; and co-leads Stanford Angels & Entrepreneurs. Clint founded and led four companies providing tools to help individuals and organizations make better decisions. He holds multiple patents in web-based decision analytics, has taught ethical decision-making, and co-authored Ethics for the Real World (Harvard Business Press 2008) with Stanford professor Ron Howard. Clint holds a PhD and an MS in Engineering-Economic Systems from Stanford University, specializing in decision analysis, and a BA in mathematics from Grinnell College where he serves as Chair of the Board of Trustees.
1 Jeff Bussgang, "What Rehab Is Teaching Me About Making Bad Investments," PEHub (2009, May 12): para. 6, http://www.pehub.com/39633/what-rehab-is-teaching-me-about-making-bad-investments/.2 Amos Tversky and Daniel Kahneman, "Judgment under Uncertainty: Heuristics and Biases," Science, 185, no. 4175 (27 September 1974): 1124.3 Ibid.4 Nassim Nicholas Taleb in his 2007 book The Black Swan: The Impact of the Highly Improbable (New York: Random House) defined a Black Swan event as a rare outlier event that has a major impact and for which human nature leads us to concoct a simplistic explanation for its occurrence after the fact.5 Chris Argyris, Teaching Smart People How to Learn (Boston: Harvard Business School Press, 2008).6 Definition of decision analysis used by Ronald A. Howard in his Stanford University class entitled Decision Analysis, Fall 1993 ongoing.7 James P. Koch, "An Economic Analysis of Textbook Pricing and the Textbook Market," September 2006, 2, U.S. Department of Education Boards and Commissions website: http://www.3cmediasolutions.org/pdf/RecommendedTextbookReports/koch_textbook_report.pdf. This study was prepared for the Advisory Committee on Student Financial Assistance, a federal panel that advises Congress on student aid issues.8 Ibid.9 Geoffrey Moore, Crossing the Chasm: Marketing and Selling High-Tech Products to Mainstream Customers (New York: Harper Business Essentials, 1999).10 Geoffrey A. Moore, Paul Johnson, and Tom Kippola, The Gorilla Game: Picking Winners in High Technology, rev. ed. (New York: HarperCollins, 1999).11 The actual value map involved substantially more detail; in this article I have shared a simplified version.12 Apple Inc. (AAPL), "Management's Discussion and Analysis of Financial Condition and Results of Operations," in Form 10-K for Fiscal Year 2011, 30, http://investor.apple.com/.13 Eric Lai and Jim Siegl, "iPad and iPad 2 Deployments," http://ipadpilots.k12cloudlearning.com/.